PIXls Chart
The PI Xls chart, where available, allows the designer to get a better understanding of variable interactions through the use of plotting. Every time any values that affect the items plotted are changed in the PIXls Designer tab, the chart will be updated. There are a number of tools to help you use and interact with the chart.
The toolbar shown below includes the following tools from left to right respectively:
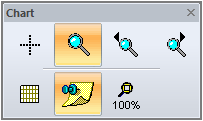
- Crosshair tool – displays the exact values for the X and Y coordinates of the point where the mouse is clicked and held.
- Zoom graph cursor – allows you to zoom in on an area in a design.
- Shift Left – shifts the viewing window to the left (only available when the chart is zoomed in).
- Shift Right – shifts the viewing window to the right (only available when the chart is zoomed in).
- View Graph Grid – toggle on or off to display or hide the graph grid.
- Show Graph Legend – toggle on or off to display or hide the graph legend.
- Zoom 100% - fits the display size of the plot area to the window.
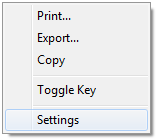
You can also right-click in the plot area to:
- Print the plot,
- Export the plot as a BMP image,
- Copy the plot to the clipboard,
- Display or hide the graph legend or key,
- Open the graph settings.
The graph settings allows you to configure the series, common options, and colors:
- Series tab – select the items to be plotted on the chart and the line styles associated with each item.
- Common tab – set the title of the plot, configure the X and Y axis labels along with the min and max values.
- Colors tab – set the window background color, the graph area color, the grid colors, and the style along with the legend background color.