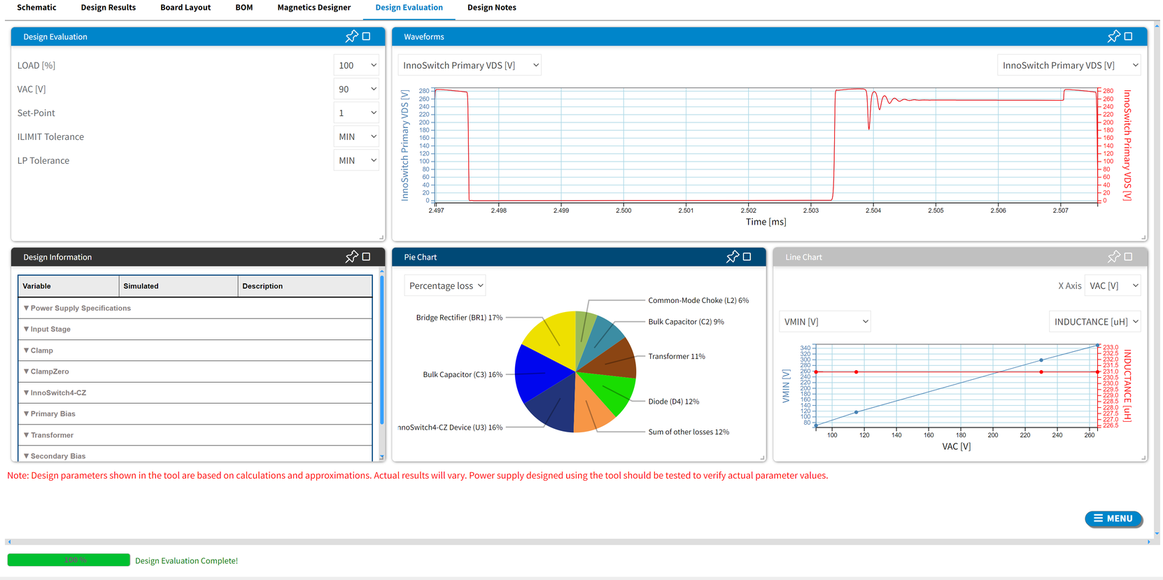
For each created InnoSwitch design, you can use the design evaluation tab to check key design parameters on all Operation Points , evaluate losses on various components and analyze key design parameter changes dynamics on Line Chart.
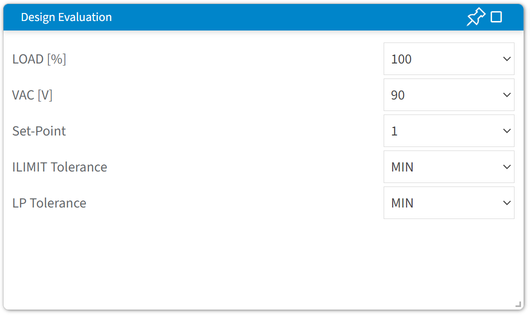
Design Evaluation window gives the user all necessary information to estimate the losses for every component at various combinations of load, input voltage and tolerance corners.
LOAD - you can select a load value within the range of 5% and 100% and analyze losses changes on each point.
VAC - you can select Input Voltage value within the range specified in Input Specification of the design and analyze losses changes on each point.
Set-Point - Power Supply operating point.
ILIMIT Tolerance, LP Tolerance - Tolerance Corners for the Set-Point (Minimal, Nominal, Maximal)
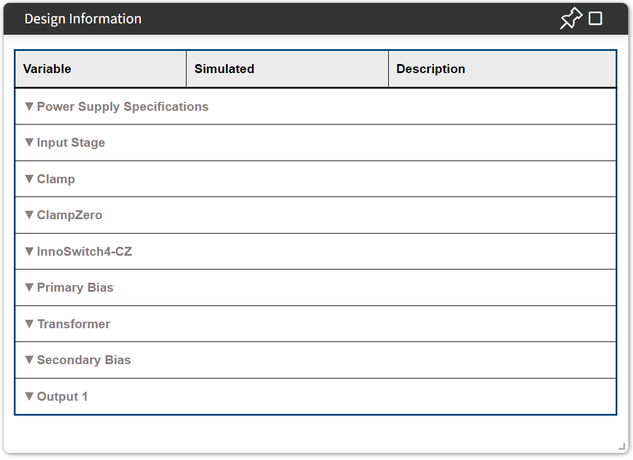
Design Information window displays values and parameters of each circuit. Click on the down arrow to open the parameters of the chosen circuit.
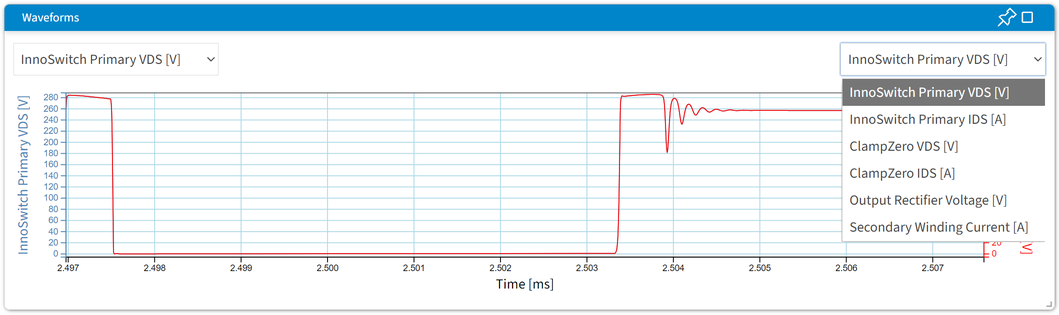
Waveforms window displays key design parameters dependencies on time. User can select two of the key parameters to be displayed on the y-axis. It will be displayed on the waveform block.
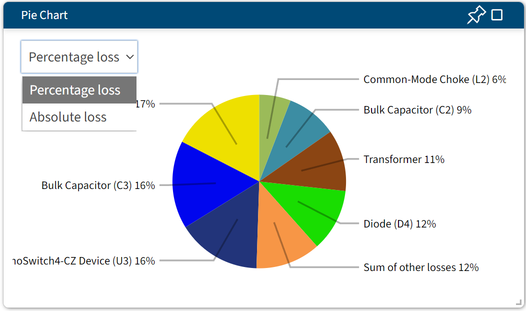
The PIE chart window displays power supply losses diagram. Diagram is recalculated and refreshed for every parameter change. You can select whether to display chart data in percentage or in absolute values. To switch between modes use drop-down box in the top right corner of the block.
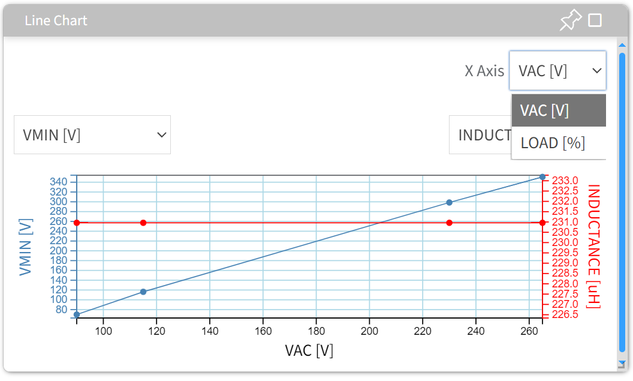
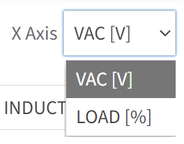
Line Chart window displays key design parameters dependencies on LOAD and VAC. To switch between LOAD and VAC select one for x-axis in the upper right corner.
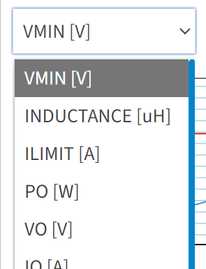
User can select two of the key parameters to be displayed on the y-axis.
It will be displayed on the line chart. The line chart is always on by default. User can disable it by clicking on the enable chart checkbox to disable chart synchronization and decrease response time after changes.